This Fair Housing Month, M-Group will begin working with communities to implement their Fair Housing Action Plans. These push for more integrated communities, ones that allow equal opportunities to work at a decent job and send one’s children to a good school. It is a dramatic step towards fairness, moving beyond the individual towards community-level strategies. It is exciting work; to be executing on commitments to help our most vulnerable neighbors in the Bay Area.
After all, what is fair about housing in California these days? More and more Californians choose between high housing costs or displacement – up to and including leaving the state. Many of our neighbors skip meals or stay in abusive relationships in order to keep a roof over their heads. Thousands have no roof at all.
And at the same time, it often feels like the deck is stacked against everyone. Other neighbors may complain that the state is forcing their neighborhoods to change, and housing developers gripe about red tape and interest rates preventing them from building new homes. In my work on housing issues over the past several years, I have noticed that if anyone is happy with housing in the state, they are surely staying quiet.
New federal and state laws have forced cities and counties to think critically about what fair housing means for the people whom they serve. The new Affirmatively Furthering Fair Housing (AFFH) guidance, required for the Sixth Cycle Housing Elements, has pushed planners to make actual commitments to improve fair housing within their boundaries. Speaking strictly for myself, this was my favorite part of the process for each of the eight housing elements I worked on this cycle. We analyzed the real and deeply felt housing issues in a community and made concrete promises to provide solutions over the 8-year planning period.
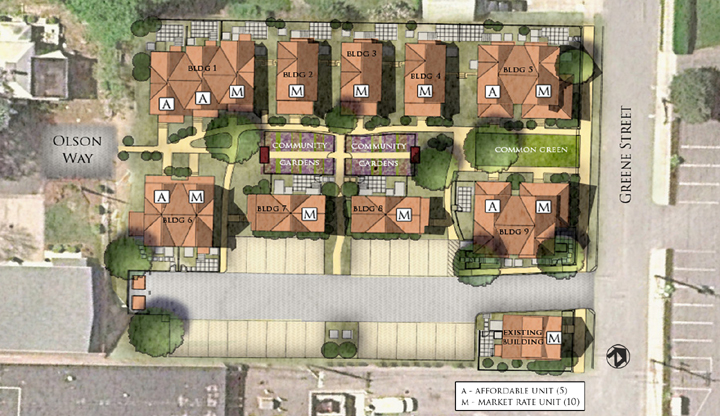
For some jurisdictions, this meant committing to building affordable housing on publicly-owned land. In others, it meant providing more resources to families suffering from homelessness due to climate-related fires and displacement. Sometimes, creative problem-solving was necessary and others just required giving firm dates to longstanding City Council priorities.
Is any of this enough? Is any of it fair? I have to acknowledge the federal definition of fair housing, which prevents discrimination on an individual or family level. I also have to acknowledge the great sacrifices and hard work that have led to federal and state fair housing law, and the generations of my predecessors who could not rely on the protection of the law. All the same, looking at the current housing crisis in California and nationwide, it seems that the law has not yet brought us to fairness.
The Fair Housing Act is about preventing exclusion and the further immiseration of our most vulnerable neighbors. New AFFH requirements go further, often in the Fair Housing Action Plans that M-Group is currently working on.
It isn’t the beginning of the work, and it is certainly not the end. This work is part of a complicated process. We want to help Californians stay in neighborhoods they want to be in, and to leave neighborhoods where they don’t feel safe. We want more housing to be built for people who want it, and more homes to be free of leaky roofs if they cover people who want to stay. We want shelters, workforce housing, missing middle housing, public housing, and all sorts of housing types for all sorts of Californians. We want sustainable housing, whether that means electrified kitchens or homes safe from wildfires, or something even more.
Sometimes people say that you can’t make everyone happy and that those tradeoffs mean that someone out there will feel jilted or put upon. But as I take on these Fair Housing Action Plans for a variety of jurisdictions, I realize that it might be easier to view these not as competing demands but as a collaborative effort. For even if it seems obvious that some housing needs are more urgent than others, it doesn’t always feel that way on the ground. In a community, though, we are all in this together. New neighbors are today’s strangers, but they are tomorrow’s babysitters, firefighters, sourdough bakers, and language instructors. The more neighbors we have - and the fewer we push out - the more opportunities we all have. Maybe fairness is not zero sum, but rather builds on itself. Maybe fairness comes one action, one household, one integrated neighborhood, at a time.
If fairness comes from multitudes, which I think it does, then fair housing is abundant housing. This means that there is plenty of work to be done.
By Asher Kohn, AICP


![[1] The FHSZs identify fire hazard, not fire risk. “Hazard” is based on the physical conditions that give a likelihood that an area will burn over a 30 to 50-year period without considering modifications such as fuel reduction efforts. “Risk” is the…](https://images.squarespace-cdn.com/content/v1/5272d2d8e4b0a406b906fed8/1524589512843-MCFVS4123TEFBITEBV3H/pic1.jpg)